5.2.10.17. eqcorrscan.utils.plotting.triple_plot
- eqcorrscan.utils.plotting.triple_plot(cccsum, cccsum_hist, trace, threshold, **kwargs)[source]
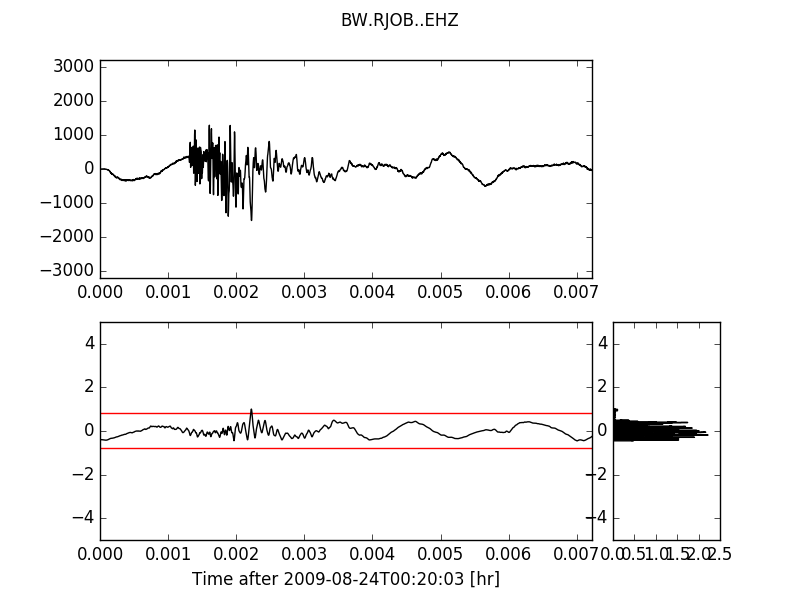
Plot a seismogram, correlogram and histogram.
- Parameters:
cccsum (numpy.ndarray) – Array of the cross-channel cross-correlation sum
cccsum_hist (numpy.ndarray) – cccsum for histogram plotting, can be the same as cccsum but included if cccsum is just an envelope.
trace (obspy.core.trace.Trace) – A sample trace from the same time as cccsum
threshold (float) – Detection threshold within cccsum
title (str) – Title of figure
show (bool) – Whether to show the figure or not (defaults to True)
save (bool) – Whether to save the figure or not (defaults to False)
savefile (str) – Filename to save figure to, if save==True (defaults to “EQcorrscan_figure.png”)
return_figure (bool) – Whether to return the figure or not (defaults to True), if False then the figure will be cleared and closed.
size (tuple of float) – Figure size as (width, height) in inches. Defaults to (10.5, 7.5)
- Returns:
Example
>>> from obspy import read
>>> from eqcorrscan.core.match_filter import normxcorr2
>>> from eqcorrscan.utils.plotting import triple_plot
>>> st = read()
>>> template = st[0].copy().trim(st[0].stats.starttime + 8,
...                            st[0].stats.starttime + 12)
>>> tr = st[0]
>>> ccc = normxcorr2(template=template.data, image=tr.data)
>>> tr.data = tr.data[0:len(ccc[0])]
>>> triple_plot(cccsum=ccc[0], cccsum_hist=ccc[0], trace=tr,
...             threshold=0.8)