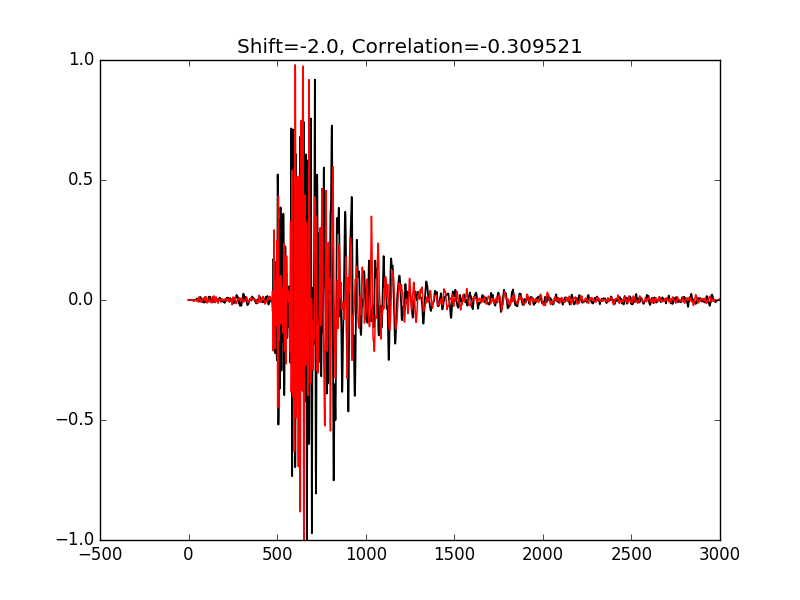
6.2.10.18. eqcorrscan.utils.plotting.xcorr_plot
- eqcorrscan.utils.plotting.xcorr_plot(template, image, shift=None, cc=None, cc_vec=None, **kwargs)[source]
Plot a template overlying an image aligned by correlation.
- Parameters:
template (numpy.ndarray) – Short template image
image (numpy.ndarray) – Long master image
shift (int) – Shift to apply to template relative to image, in samples
cc (float) – Cross-correlation at shift
cc_vec (numpy.ndarray) – Cross-correlation vector.
title (str) – Title of figure
show (bool) – Whether to show the figure or not (defaults to True)
save (bool) – Whether to save the figure or not (defaults to False)
savefile (str) – Filename to save figure to, if save==True (defaults to “EQcorrscan_figure.png”)
return_figure (bool) – Whether to return the figure or not (defaults to True), if False then the figure will be cleared and closed.
size (tuple of float) – Figure size as (width, height) in inches. Defaults to (10.5, 7.5)
- Returns:
Example
>>> from obspy import read
>>> from eqcorrscan.utils.plotting import xcorr_plot
>>> from eqcorrscan.utils.stacking import align_traces
>>> st = read().detrend('simple').filter('bandpass', freqmin=2, freqmax=15)
>>> shifts, ccs = align_traces([st[0], st[1]], 40)
>>> shift = shifts[1] * st[1].stats.sampling_rate
>>> cc = ccs[1]
>>> xcorr_plot(template=st[1].data, image=st[0].data, shift=shift,
...            cc=cc)