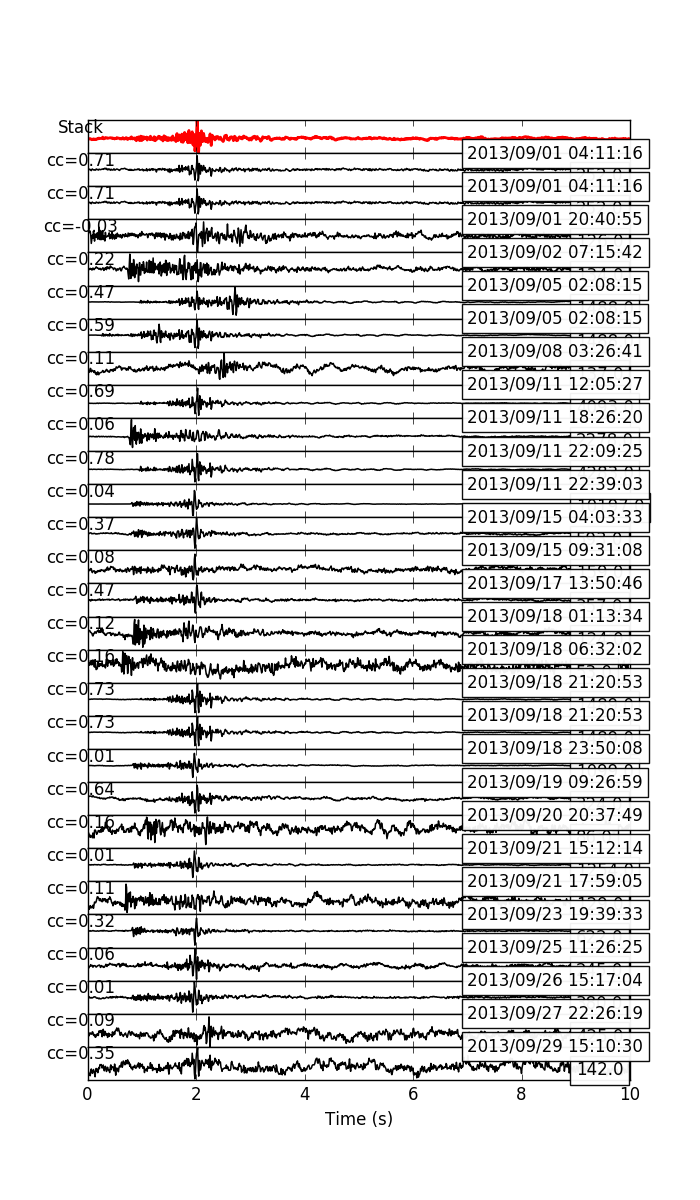
6.2.10.6. eqcorrscan.utils.plotting.multi_event_singlechan
- eqcorrscan.utils.plotting.multi_event_singlechan(streams, catalog, station, channel, clip=10.0, pre_pick=2.0, freqmin=False, freqmax=False, realign=False, cut=(-3.0, 5.0), PWS=False, **kwargs)[source]
Plot data from a single channel for multiple events.
Data will be aligned by their pick-time given in the appropriate picks. Requires an individual stream for each event you want to plot, events are stored in the
obspy.core.event.Catalogobject, and there must be picks present for the streams you wish to plot. Events will be aligned if realign=True, in this case the traces will be aligned using the window defined by cut.- Parameters:
streams (list) – List of the
obspy.core.stream.Streamobjects to use, can contain more traces than you plan on plotting (e.g. from more channels) - must be in the same order as events in catalog.catalog (obspy.core.event.Catalog) – Catalog of events, one for each stream.
station (str) – Station to plot.
channel (str) – Channel to plot.
clip (float) – Length in seconds to plot, defaults to 10.0
pre_pick (float) – Length in seconds to extract and plot before the pick, defaults to 2.0
freqmin (float) – Low cut for bandpass in Hz
freqmax (float) – High cut for bandpass in Hz
realign (bool) – To compute best alignment based on correlation with the stack or not.
cut (tuple) – tuple of start and end times for cut in seconds from the pick, used for alignment. Will only use this window to align the traces.
PWS (bool) – compute Phase Weighted Stack, if False, will compute linear stack for alignment.
title (str) – Title of figure
show (bool) – Whether to show the figure or not (defaults to True)
save (bool) – Whether to save the figure or not (defaults to False)
savefile (str) – Filename to save figure to, if save==True (defaults to “EQcorrscan_figure.png”)
return_figure (bool) – Whether to return the figure or not (defaults to True), if False then the figure will be cleared and closed.
size (tuple of float) – Figure size as (width, height) in inches. Defaults to (10.5, 7.5)
- Returns:
Aligned and cut
obspy.core.trace.Trace- Return type:
list
- Returns:
New picks in based on alignment (if alignment is performed, if not will return the same as input)
- Return type:
- Returns:
Figure object for further editing
- Return type:
Example
>>> from obspy import read, Catalog, read_events
>>> from obspy.io.nordic.core import readwavename
>>> from eqcorrscan.utils.plotting import multi_event_singlechan
>>> import glob
>>> sfiles = glob.glob('eqcorrscan/tests/test_data/REA/TEST_/*.S??????')
>>> catalog = Catalog()
>>> streams = []
>>> for sfile in sfiles:
...     catalog += read_events(sfile)
...     wavfile = readwavename(sfile)[0]
...     stream_path = 'eqcorrscan/tests/test_data/WAV/TEST_/' + wavfile
...     stream = read(stream_path)
...     # Annoying coping with seisan 2 letter channels
...     for tr in stream:
...         tr.stats.channel = tr.stats.channel[0] + tr.stats.channel[-1]
...     streams.append(stream)
>>> multi_event_singlechan(streams=streams, catalog=catalog,
...                        station='GCSZ', channel='EZ')